Valuation Ratios
Valuation Ratios
Price to Earnings (PE) ratio
Price to Earnings Ratio = Share Price / Annual EPS
The PE ratio is the most widely used and quoted valuation metric. As the name implies, it is the ratio of share price to earnings per share. It represents how much investors are paying for every $1 the company earns. For example, a PE ratio of 20 means investors are paying $20 for every $1 the company earns. You can also think about it as the number of years it would take for a company to earn back its share price. In this example, if you purchase a share in this company it would take 20 years for the company to earn back your $20. The PE ratio is also called the earnings multiple, because it presents share price as a multiple of its earnings per share (EPS).
Earnings can be measured on a forward or a trailing basis. Usually the PE ratio is quoted on a trailing basis, meaning it is calculated using EPS for the last 12 months (usually designated with the suffix TTM, meaning Trailing Twelve Months). The forward PE ratio is calculated using estimates of EPS for the next 12 months.
The forward PE ratio is considered more relevant than the trailing PE ratio investors should be more concerned about what the company will make rather than what it has made in the past. However, estimates can be wrong. The trailing PE is more grounded, but makes the assumption that earnings will be similar in the future.
PE ratios rise and fall as investors try to anticipate how much money the company will make in the future. And investor perceptions are highly influenced by human emotion. When investors are optimistic, prices rise much more than the increase in earnings implied by whatever positive piece of news that was released. In this situation, PE ratios are inflated, indicating the stock is likely overvalued. On the other hand, when investors are fearful or pessimistic, prices fall much less than the implied decrease in earnings, PE ratios are lower, and the stock is likely undervalued.
The PE ratio and earnings per share together explain 100% of movements in share price.
Share price always follows earnings per share (EPS) over the long-term. All other movements in share price can be explained by the relative optimism or pessimism that is captured by movements in the PE ratio. When EPS rises but price falls, the PE ratio necessarily contracts, and when EPS falls but price rises, the PE ratio necessarily expands.
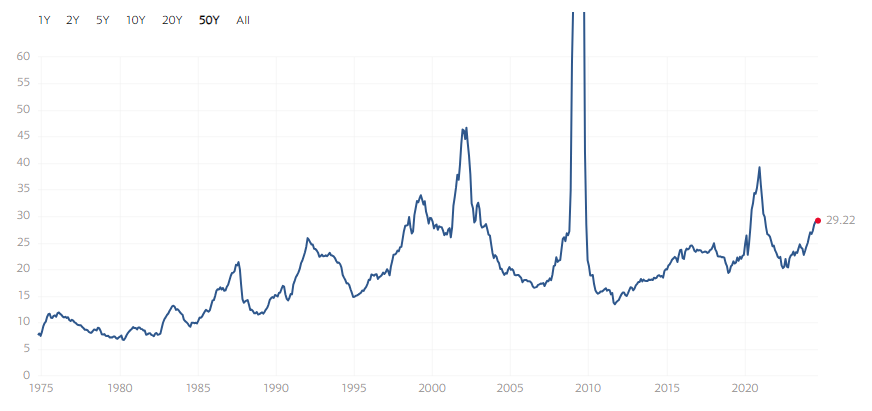
Below you can see how the average (trailing) PE ratio of the S&P 500 Index has changed over time. At the time of writing, anything trading below a 30 PE ratio would be considered cheap. This is because investors are anticipating earnings to grow significantly in the future. According to S&P Global, the forward PE ratio is much lower at 21.41 which is closer to its historical level.
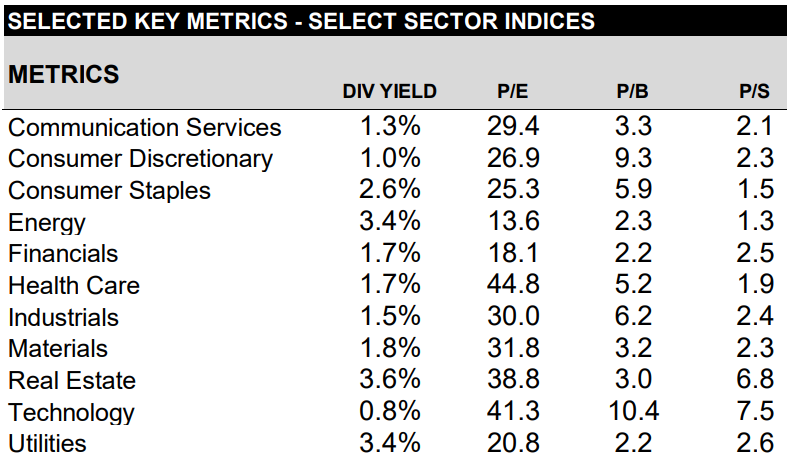
However, it is not always fair to compare the PE ratio of a company to the market average. Every company is different and earnings fluctuate up and down differently for each one. As you can see below, the average PE ratio varies significantly between market sectors.
This is an important concept that is recurrent in fundamental analysis. Because each company is different, all financial metrics or ratios should not be looked at in isolation but should be measured relative to similar companies or the sector average.
Another way to can assess the valuation is by looking at the PE ratio over time. Just like we did with the S&P 500 Index above, we can compare the current PE ratio the historical average to see whether the stock is cheaper compared to itself. If a company was earning 20¢ per share when it's stock was trading at $1.00 and now it is earning 25¢ while it's stock trading at $0.90, it is reasonable to assume that the stock undervalued. However, this requires that the stock was not overvalued to begin with and that nothing else has changed in order to bring down its intrinsic value.
Price to Earnings Growth (PEG) Ratio
PEG ratio = PE ratio / EPS growth rate (%)
Back in our example where the PE ratio is 20, investors are paying $20 for every $1 the company earns. But what if the company earns $2 next year, followed by $3 and $4 and so on? It will take much less than 20 years for the company to earn investors' money back. This company is clearly more valuable so it is reasonable for the PE ratio, which uses present earnings in its calculation, to be higher.
High expected growth rates should cause PE ratios to be higher.
The PEG ratio takes into account earnings growth to provide an easier metric to compare the valuation of companies. The PEG ratio may reveal companies that appear overpriced at first glance, but are actually cheap when growth is factored in. Likewise, companies that have a high PE ratio but are not growing as fast will have a higher PEG ratio and therefore appear more expensive.
The EPS growth rate in the denominator can come from historical earnings growth (a trailing basis), or estimated future earnings (a forward basis).
In general, you should look for a PEG ratio below or around 1.0. However, there are still factors other than growth that can effect valuation, so it is still important to compare the PEG ratio on a relative basis.
One of the shortcomings of the PEG ratio is that growth is not always positive. In fact, pretty much every company will experience negative growth at some point in its life. And when growth is negative the PEG ratio is negative, which has no meaning at all. This pretty much disqualifies the PEG ratio from being used in sectors where growth fluctuate, like energy or mining, and during economic downturns. However, in all other situations the PEG ratio is one of the best for assessing valuation.
Price to Sales (PS) Ratio
Price to Sales Ratio = Share Price / Annual Revenue per Share
The PE ratio does not work if earnings are negative, which is common for startups and younger companies. In this situation, the PE ratio becomes negative and loses its meaning. One way of dealing with this is to use the price to sales ratio instead.
The PS ratio is similar to the PE ratio, but has revenue per share instead of earnings per share in the denominator. This can be helpful in assessing younger companies because revenue is always positive. It can be used in all the same ways as the PE ratio.
You can see in the figure above how the average PS ratio is much greater for the real estate and technology sectors. This is because costs are much lower for these industries (lower costs, greater earnings, and higher share price).
However, this ratio does not take costs into account and therefore relates less closely to how much shareholders get to take home than the PE ratio does. For this reason, I would recommend only using the PS ratio as a stand-in when the PE ratio can't be used.
Price to Book (PB) ratio
PB ratio = Share Price / Shareholder's Equity per Share
The price to book ratio is another valuation ratio, like the PE or PS ratio, except it has shareholder's equity in the denominator. As a quick reminder, shareholder's equity or book value is how much would be left over if all assets were sold and debts paid off. It provides a floor or minimum value for a company, because even if the company never earned another dollar it could unwind its books and realise its book value.
An advantage of the PB ratio is that it works for companies that don't make money. In the case when a company's earnings is negative (making the PE ratio useless), we can still use the PB ratio to determine whether the company is under or overpriced.
The PB ratio is also beneficial if a company's earnings fluctuate up and down, like in the financial and mineral industries. At the bottom of the economic cycle the earnings of these companies are at their lowest, so they appear more expensive relative to earnings and therefore seem like a poor investment. In reality, this is exactly when you want to buy these companies. Since a company's book value tends to stay relatively constant over time, the PB ratio can be used to get around these fluctuations.
In his famous book on value investing, The Intelligent Investor, first published in 1949, Benjamin Graham suggests looking for a PB ratio below 1.0. However, the figure above, which is the same from the previous chapter, shows that this figure is extremely far below any of the sector averages. Trading below 1.0 indicates that investors would literally be better off if the company ceased operations and unwound its books. This situation is extremely rare because, in general, businesses grow over time which provides value above and beyond the book value.
These days, you will rarely find a stock trading below a PB ratio of 1.0. The explosion of technology since The Intelligent Investor was first published has significantly changed growth rates and expectations of investors. Furthermore, because of the significant differences between market sectors, I don't believe there is an absolute figure you should look for in the PB ratio. You should use the PB ratio to compare companies within the same sector, or compare it to the PB ratio of the same company on a historical basis.
Price to Free Cash Flow (PFCF) Ratio
Price to Free Cash Flow (FCF) Ratio = Share Price / Free Cash Flow per Share
The price to free cash flow ratio is a valuation ratio just like the PE ratio, except it compares share price to free cash flow.
The advantage of the price to free cash flow ratio over the PE ratio is that it is based on the actual cash generated by the core business, after accounting for capital expenditure. As we know, the PE ratio is based on earnings which include non-cash items and one-time or non-recurring events, which can be misleading as to actual profitability.
The price to free cash flow ratio can be used in all the same ways as the PE ratio. However, the difference between sectors can be more pronounced than the PE ratio. Some sectors, such as mining and industrials, require large amounts of fixed assets to operate, meaning capital expenditure is greater and free cash flow is lower. Other sectors, like technology, require very little fixed assets so free cash flow is higher.
Simulator
Use the simulator below to see how changing different items from the three financial statements affects the valuation ratios discussed.
| Revenue Core Operations | $ |
| Other Revenue | $ |
| Total Revenue | $90,000 |
| Capital Expenditure | $ |
| Other Expenses | $ |
| Net Income | $68,000 |
| Shares Outstanding | |
| Earnings per Share (EPS) | $4.53 |
| Total Assets | $ |
| Total Liabilities | $ |
| Shareholder's Equity | $90,000 |
| Operating Income | $60,000 |
| Capital Expenditure | $12,000 |
| Free Cash Flow | $48,000 |
Summary of Key Concepts
- The PE ratio is a measure of the company's valuation relative to earnings per share. You should compare the PE ratio to that of companies in the same industry.
- The greater the expected growth, the higher the PE ratio will (or should) be.
- Short-term fluctuations in price can be thought of as expansions or contractions in the PE ratio according to investor sentiment.
- The PEG ratio is a way of incorporating growth when measuring intrinsic value.
- The PS ratio can be used as an alternative to the PE ratio for companies with low or no earnings.
- The PB ratio can be used as an alternative to the PE ratio for companies whose earnings fluctuate over time.
- It is good practice to use the PFCF ratio in conjunction with the PE ratio.