The Income Statement
Income Statement
The income statement is the first of the three financial statements reported by a company. It is a snapshot of the company's business over a selected period and shows the money coming into and out of it over that time. It provides insight into the profitability or efficiency of a company, and how it changes over time.
Every company prepares the income statement slightly differently, but most often it will include the following.
Revenue
Revenue or sales is the money the company earned through the sale of goods or services in the normal course of business. Normal operations refer to what the business does to earn a profit on a regular basis. Things that are considered non-recurring or extraneous are excluded.
Cost of Goods Sold (COGS)
Cost of goods sold or cost of sales is the money the business spent to produce, handle, or deliver products to customers. This includes things like acquisition costs, raw materials, labour, and distribution or transportation costs. For a retailer like Target, this is the amount paid to acquire the item plus the costs incurred in selling it to you, such as transportation and labour costs.
Research and Development (R&D)
Research and development expense is how much the company spent on growing or improving its business. This includes market research to determine consumer preferences, developing new products, or improving existing ones.
Selling, General, and Administrative (SG&A)
Selling, general, and administrative includes all other costs incurred by the company. This most often includes marketing, advertising, rent, and utilities.
Interest Expense
Interest expense is how much the company spent on paying back its loans.
Income Tax
Income tax is the amount paid or the amount the company expects to pay in tax.
Net Income
Net income or profit is the money the company gets to keep after all expenses are paid. It is essentially the net increase in wealth over the period.
Earnings per Share (EPS)
Earnings per share or EPS is the net income earned on a per share basis. Mathematically, earnings per share equal to net income divided by the average shares outstanding. Shares outstanding is simply the number of shares owned by shareholders.
Where net income is the net increase in wealth to the company, earnings per share can be thought of as the net increase in wealth that each share earns its owner. This is important because it provides insight into that elusive intrinsic value that it is the objective of this section to find. We can compare earnings per share with share price to assess whether a stock is undervalued or overvalued, as we will see when we discuss the PE ratio.
Depreciation and Amortization (D&A)
Depreciation and amortization is the amount by which the company's assets lose value over time. For example, a truck used to transport goods cannot operate forever and will inevitably require a service or be sold for parts at the end of its life. Either of these events will result in the loss of an asset.
The term depreciation refers to when a tangible asset loses value, like the truck in the above example. Amortization is the same thing but for intangible assets, like a patent. We will cover the difference between tangible and intangible assets when we discuss the balance sheet.
This is an example of a non-cash event. Even though there is no outflow of money, the loss of the asset is spread out over the course of its life. This is done so that there are no big changes in the company's balance sheet at the end of the asset's life, which has implications for the amount of tax the company pays.
Other Items
Net income is not the only important measure of profitability. Often other items like the ones below are included to provide additional information.
Gross Income
Gross income is the company's profit after deducting COGS from its revenue. It is the amount of money the company makes by purely selling its product, before deducting any other operating expenses such as R&D and SG&A.
Operating Income
Operating income is the company's profit after deducting COGS and operating expenses such as R&D and SG&A. It is the amount of money the company makes after deducting expenses required to keep the business running. It excludes expenses that are unrelated to the core operations, such as interest payments and tax.
Reading the Income Statement
The income statement is arranged with revenue at the top, with expenses and other costs listed in order of significance. The money can be seen as trickling down from revenue at the top, with a little bit going each to each line underneath, all the way to net income at the bottom. Related items are grouped together and the lines relating to a sum are often underlined.
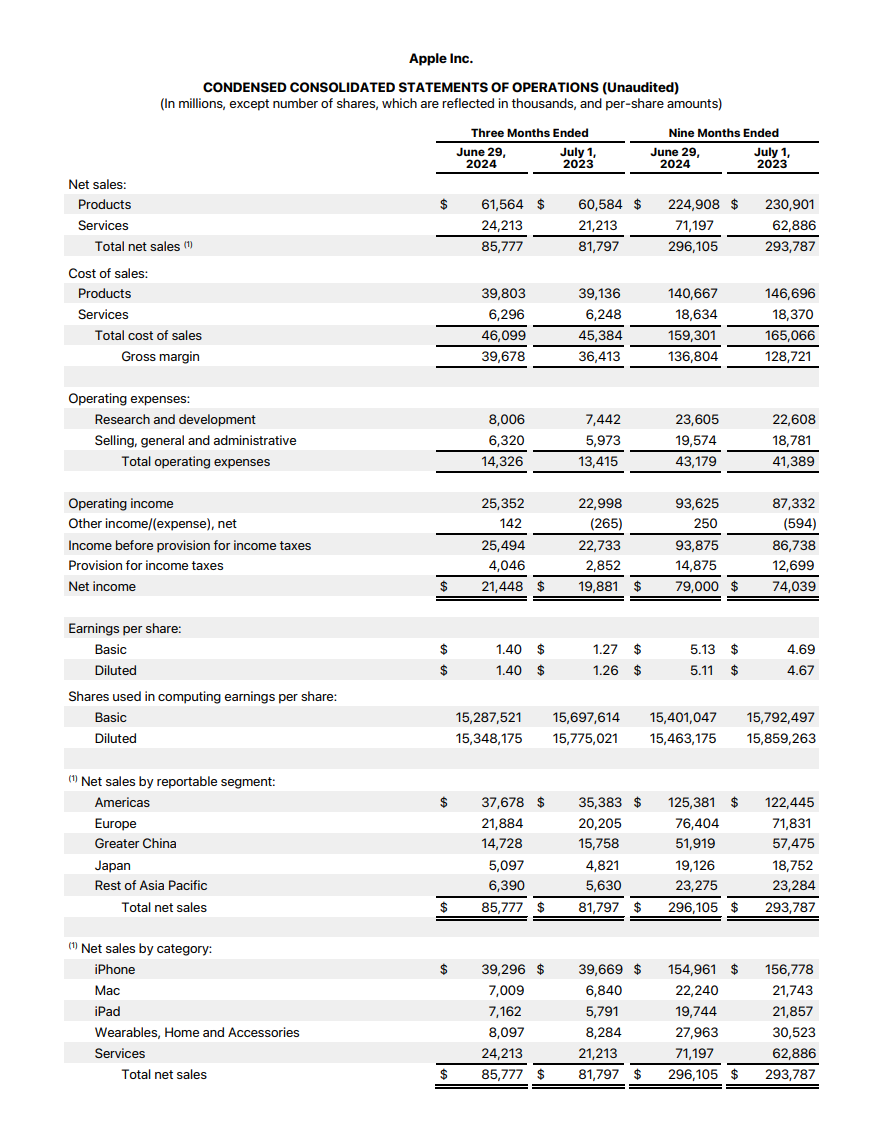
You will see how the underlined items are equal to the sum of the ones above. Using Apple's income statement as an example, we can see that the Gross Income for June ($39,678 million) is equal to Net Sales ($85,777 million) minus Total Cost of Sales ($46,099 million).
We can then use this sum to help us calculate some of the items below it. For example, Operating Income is equal to Gross Income ($39,678 million) minus Total Operating Expenses ($14,326 million), which is $25,352 million.
The income statement below is interactive. Try to adjust some of the values and see how they affect the line items below.
| Revenue | $ |
| Cost of Goods Sold (COGS) | $ |
| Gross Income | $44,000 |
| Research & Development (R&D) | $ |
| Selling, General & Administrative (SG&A) | $ |
| Total Operating Expenses | $14,000 |
| Operating Income | $30,000 |
| Interest Expense | $ |
| Income before Tax | $29,000 |
| Income Tax | $ |
| Net Income | $25,000 |
| Shares Outstanding | |
| Earnings per Share (EPS) | $1.667 |
Summary of Key Concepts
- The income statement shows the money that came into and out of the business during the period.
- Money trickles down from revenue at the top to net income at the bottom.
- The PE ratio is a measure of the company's valuation relative to earnings per share. You should compare the PE ratio to that of companies in the same industry.