Analyst Forecasts & Company Guidance
Analyst Forecasts
As we know, growth is an incredibly important factor in valuing a company. The problem with relying on historical reports to measure growth is that it assumes past results will continue into the future.
To solve this problem, professional analysts from large institutions like banks, brokerage firms, and independent research houses, spend countless hours modelling all sorts of fundamental and macroeconomic factors in order to estimate or forecast future earnings. Investors are able to use these estimates to get an idea of the future growth and financial performance of a company.
Analysts frequently have different methods, data, and opinions about the future which can cause their forecasts to differ significantly. All of the forecasts from different analysts are averaged to form a consensus. The consensus reflects the wisdom of the crowd and is deemed to be the most accurate. The consensus estimate is usually the figure used to calculate forward-looking fundamental indicators like the forward PE ratio or PEG ratio.
However, the validity of the consensus estimate is dependent on the number of analysts covering the stock. Small cap companies are typically covered by few analysts, meaning the consensus does not capture a wide enough range of opinions to have any more predictive power than a single analyst.
The highest and lowest analyst forecasts can also provide useful information. The low forecast reflects the opinion of the most pessimistic analyst, and can be viewed as a worse case scenario. We can use the low forecast to calculate the minimum growth rate we can expect from the company. We can have a high level of confidence investing in a company if we assess it to be undervalued even under minimum expected growth.
On the other hand, the high forecast is the most optimistic and shows the potential upside under the best case scenario. However, relying on the best case scenario creates significant downside risk in the case that it does not play out. Remembering Warren Buffett's first rule of investing (don't lose money), we would rather base our investment decisions on the worst case scenario to limit our downside risk.
Consensus estimates are often used as a basis to assess the quality of reported revenue and earnings when they are released. A company is said to have beat if it reports earnings above the consensus estimate, and missed if it reports below. Investors who were relying on estimates to assess the company's valuation will buy or sell accordingly, which is why stocks can move so much when they report.
I think this terminology is slightly misleading. If reported earnings deviate significantly from the consensus, it is analysts who missed, not the company. Investors often panic when a company miss earnings and the stock drops significantly. However, if there was no significant problem revealed by the report to change your investment thesis, these events are usually nothing to worry about.
Analyst Price Targets
Analysts also use their forecasts to estimate fair value and provide a price target for the stock. That's great, right? We have just spent all this time learning about fundamental analysis to determine whether a stock is under or overvalued, when professional analysts can give this to us for free. In reality, analyst price targets have a very low hit rate. Analysts price targets not only have a large error rate, but only correctly predict the direction of price movements 54% of the time. That means that stocks don't even move in the direction of the price target about 50% of the time.
Under the Efficient Market Hypothesis, it is not possible for a piece of information that is widely available to help predict price movement because it has already been incorporated into the current price.
To add to the issue of relying on them, analyst forecasts tend to group together. As mentioned, the consensus is supposed to reflect the wisdom of the crowd, so no single analyst wishes to differ significantly from the consensus and risk being wrong. At least if an analyst's forecast is close to the consensus, they will be no more wrong than the rest of the market if it proves incorrect. That analyst gets to keep his job.
Furthermore, because they are human just like you and I, analysts can and do become subject to emotion. They tend to inflate estimates when the market is optimistic, even more so due to the abovementioned grouping effect, and depress them when the market is pessimistic.
Company Guidance
If there was one party that knew a company better than analysts, it would be that company's management. When companies release earnings reports they often include revenue or earnings guidance to inform investors how much they expect to make in the next quarter or financial year.
Like analyst forecasts, company guidance can be used to assess the future growth of a company. Since management understand the company intimately, the guidance they provide is considered highly accurate. Analysts will often speak with management and use their guidance to inform their estimates. Unless analysts have a strong reason to disagree with management, consensus forecasts will often be very close to guidance.
Guidance can often be more significant than the reported earnings. The market is forward-looking, meaning investors care more about what will happen than what has happened. Frequently a company will beat consensus estimates for earnings, but the stock drop significantly due to disappointing guidance.
Institutional Ownership
Institutional ownership is possibly one of the best fundamental indicators. Institutions are investment entities like Super funds, mutual funds, investment banks, and hedge funds. They are commonly referred to as the "smart money" because they supposedly have an intellectual advantage over the rest of us. These are professionals after all, they must know what they’re doing.
In all seriousness, a high level of institutional ownership indicates a high level of confidence in the underlying company and is usually a good sign. Institutions are required by law to disclose their holdings each quarter. You can usually find the portion of shares owned by institutions on the exchange website, such as below.
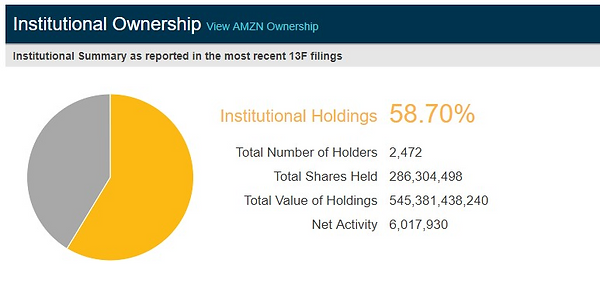
It is also good to look for companies that show increasing institutional ownership. This means that these intitutions have assessed the company and deemed it to be undervalued or have a high potential for growth.
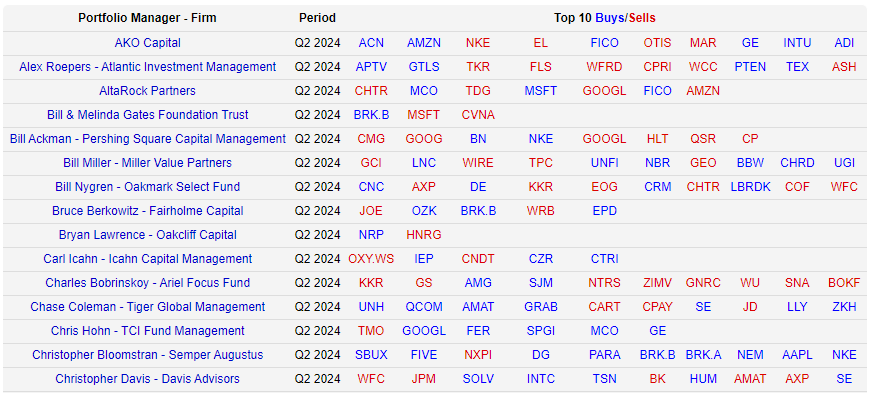
Dataroma is a great website that tracks the portfolios of up to 80 "Superinvestors." You can see the stocks held by these investors, what they bought and sold during the most recent quarter, as well as the stocks that are the most or least popular.
Seeing institutions buy a stock is not a green light to jump right in and buy it yourself. This is because the release of institutional holdings is delayed, meaning when you see a stock in one of these institutions' portfolios they likely bought it some time ago. It is likely that things have changed since then (maybe the stock has gone up and is no longer undervalued), and the same investor would not buy that stock again today. Additionally, you don't know this investor's reasons for buying something. Owning this stock becomes a guessing game. If the stock falls by 20% should you buy more or should you sell it? You want to have your own investment thesis so you can use to make decisions like these on your own.
Additionally, high institutional ownership could be a sign that a stock is overbought. When everything is going well, institutions, just like everyone else, are optimistic and buy until the price exceeds fair value. Then when everyone has bought the stock, there are no buyers left to support the price, and only one way for it to go - down. And because of the sheer number of shares these institutions own, price can swing dramatically when they decide to sell.
In fact, stocks that have minimal insitutional ownership can sometimes provide better investment opportunities. Assuming the company is any good, you can buy a stock like this before it is discovered by large institutions. Again, due to the amount of money these institutions have, they can push the price up significantly when they start buying. Other investors then see that institutions are buying the stock and push price up even further when they decide to buy themselves.
I like to use Dataroma as a starting point for investment ideas. I try to identify stocks that I like and institutions are also buying. Once I find a stock, I conduct my own research and use the techniques discussed in this section to make my own investment decision.
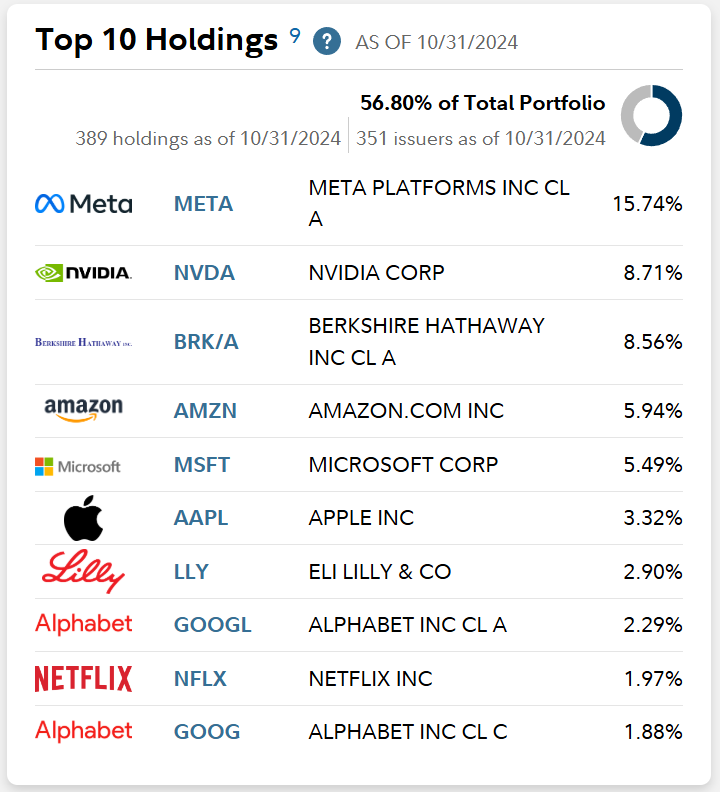
Another good thing to look at is the top holdings of some of the top funds via a Google search. This also serves as a good starting point for you to begin your search for top stocks.
Summary of Key Concepts
- Analyst estimates can provide insight into expected earnings growth.
- The range between the high and low analyst estimates indicates the level of certainty or uncertainty of expectations.
- Analysts, like everyone else, are subject to emotion! They tend to underestimate earnings when sentiment is pessimistic and overestimate when it is optimistic.